The lifeblood of all good investors is financial information. It is difficult, if not impossible, to make a reasoned judgment about a company’s future prospects unless you have analyzed its past performance. For this reason, it is my opinion that effective investor web sites need easily accessible financial information. Not information that is squirreled away in the press release or the latest regulatory filing, but financial information that stands alone and, at the least, summarizes the company’s key operating numbers. There are a number of ways to approach this data and I will highlight a couple that I think are well done.
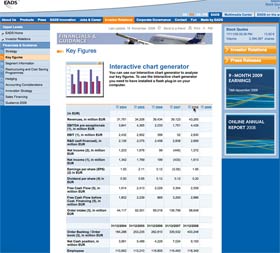
First, the aerospace company EADS does a good job setting out summary financial information under the heading “Key Figures”. As you can see below, the company has extracted summary information from the income statement, balance sheet and cash flow statements and some other important data into a single page to provide investors with a quick overview. EADS also does several other interesting things on the page. They provide a link to an interactive chart generator (more about that in another post), they allow you to drill down into quarterly data for each year by clicking on the year at the head of the column, and a link on the side leads you to segment information. All in all, this is a very efficient presentation of key financial information.
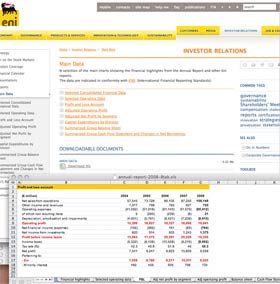
The Italian energy company, ENI takes this approach one step further by providing eight different sets of data for the interested investor to browse through and even provides the ability to download all the data in Excel spreadsheet format. My only objection to the information is that ENI makes it difficult to find, tucking it away in a section they label “Main Data”. But once you’re there, it’s all that a data geek investor could ask for, laid out on a single page.
In this series:
Previous post: Eye candy for stock charts
Next post: Provide context
 Obviously, this is much longer than 140 characters (414 characters according to my word processor). The danger arises as Lisa tries to pare down the language to fit into Twitter’s restrictive size requirement.