There is an old saying in business, “If you can measure it, then you can manage it”. 
The corollary to this is that if management thinks it is important enough to measure closely then investors ought to know about the measure so they can make their own assessment about how important it is to their ownership of the stock.
Unfortunately, this is rarely the case. There is a whole raft of business literature about using key performance indicators and dashboard techniques to run your business, but when you go looking for them on company websites, they are few and far between.
I am not advocating that investors need to be informed of every operating metric the company generates. This, in addition to being overly intrusive, would result in information overload, as the best companies produce many key performance indicators at all stages of their business. Further, too much detail would result in the revealing of proprietary information to competitors. But often there are five or six key data points that a company watches extremely carefully. These are the criteria that they often base performance reviews and compensation upon. And people will do what they are compensated and rewarded to do.
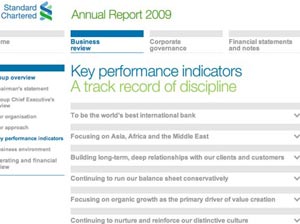
One company that does discuss key performance indicators in their online annual report is Standard Chartered. They do this first with an overview of the areas they wish to highlight, which I’ve set out here (click image to see a bigger view).
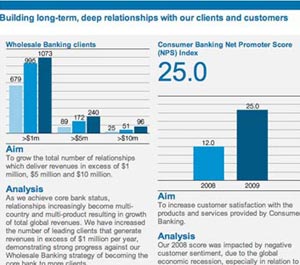
When you click on one of the sections such as “Building long-term, deep relationships with our clients and customers”, it opens up to specific KPIs, a portion of which is copied below. The result is a good, quick look at both the measures Standard Chartered thinks important and how they are performing against those measures.
Now if we can just get companies to do more of this and feature it someplace where it is easy to find, investors will more readily understand the way the business is being run.
In this series:
Previous post: Differentiation
Next post: Shareholder FAQ

 A little less than a year ago, I began writing about the
