Having established last time that a roadmap to the relevant investor information is essential on the main investor relations page, this piece will discuss one of investor relations more popular destinations – the share price page. You might think that this would be a simple enough thing to do – throw a graph of the share price up on the screen and let it go at that. But there is a lot more to it than that and companies that pay attention to this area can save their shareholders (particularly individual investors) quite a bit of frustration by thinking the site through.
The first thing to realize is that there are several distinct sets of information that investors are looking for when they visit your site for share price information. First, there is immediate information: what is the stock price doing now? Next, there is graphical information: what does the price chart look like? Third, there is historical information: what was the stock price on a certain date? I will be breaking down all of these parts in due course, but today I will be concentrating on immediate share price information.
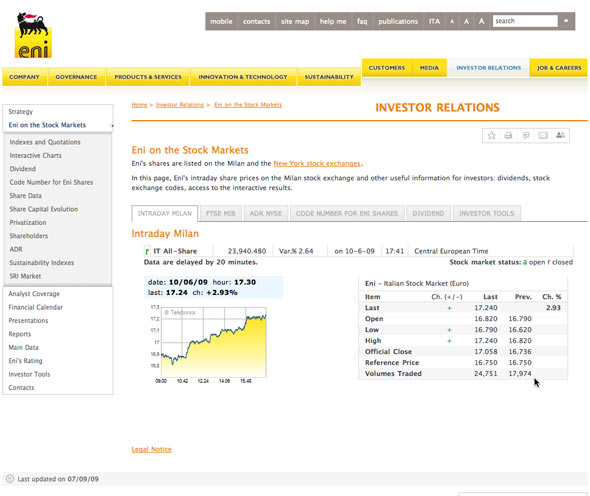
There is a standard set of information that investors expect to see when looking at current price: last trade, open, high, low, change, volume and whether the information is real time or delayed. Below is a screen shot from the web site of ENI, the Italian energy company that does a good job setting out intraday information. Because ENI is traded on multiple markets, they also provide tabs to view the information for the particular market you may be interested in.
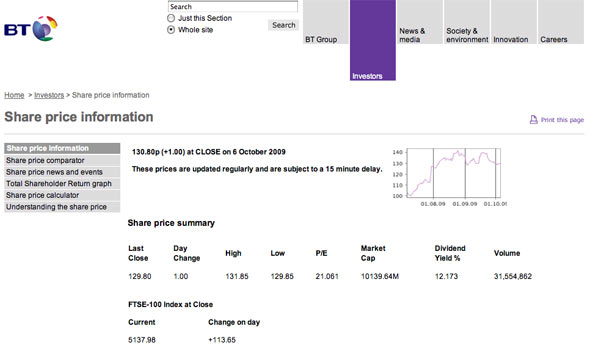
Another good example comes from BT, the telecom company, and below is a screen shot of a portion of their page on share price information. Note that BT adds in the P/E ratio and the dividend yield as additional pieces of information on the stock. Further, BT also shows what the relevant index, the FTSE 100 did on the day in question, so you have a reference point, although if they are going to do that, they should include the percentage change for both their stock and the index rather that the pure price change in order to facilitate understanding of the stock price change relative to the index.
Having established what the current trading in the stock is, companies should then move on to placing the stock price in historical context by the use of price chart graphs. In addition to the basics, there are many interesting things companies can do to help investors and I’ll be covering some of them next time.
In this series:
Previous post: Provide a Roadmap
Next post: Share price charts
 Zack has been working with and coaching remote teams at organizations like JP Morgan, 3M, Nortel, Hewlett Packard, and the United States Navy since 2001. He has served as a consultant to numerous Fortune 500 companies and is a consulting engineer for the Novell Compliance Management Platform.
