Do you want to be seen as open and transparent?
People want to know who has money invested in your company, and you should explain this – though you don’t need to mention everyone!
I’ve found 8 different ways that companies have used to disclose and explain their shareholder structure.
This is usually done by one of the following four methods:
- Giving a list of the top 10 or 20 shareholders (by size of shareholding)
- Showing the structure of your shareholder base by size of shareholding
- Providing details of the shareholders by geography
- Giving details of the different categories of share (e.g. ordinary shares, or preference shares).
Indeed, the Investor Relations Society (UK) recommends providing:
- Shareholding analysis by size of holding, type of holding and geographical origin.
- Details of the percentage holdings of principal shareholders.
But what about telling us:
- The percentage share of the votes?
- The changes to the shareholder base over the last quarter – or several quarters?
- The proportion of retail investors to professional investors?
- The proportion of shares held by the directors or other named individuals (who are probably not the principal shareholders in a big company)?
Examples of shareholder analysis in corporate websites
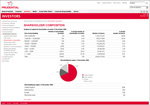
- Prudential gives details of its share-ownership structure by size of shareholding and by geography. This lets us see which country the main shareholders are based in.
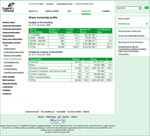
- Legal and General give details of their share-ownership structure by type of shareholder and by size of shareholding.
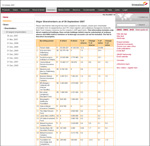
- Stora Enso tell us what percentage of the shares (and votes) that each type of shareholder has – and by what percentage that has changed over the last quarter. This is very interesting, and lets us see which type of shareholder is selling, and which buying.
- Stora Enso also name their top 20 shareholders, and give us this information over a period of several years – again, this lets us see the trends emerging.
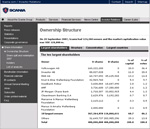
- Scania have a tab-based display of this information on the same page: so, we are told the top 10 shareholders; the ownership structure; the concentration of shares and votes; and the countries the investors come from.
Are your shareholders primarily retail or professional investors? That’s interesting – why not tell me up front? Look back at the Legal and General example and the Stora Enso example … these companies let us know what type of investor is interested in their stock.
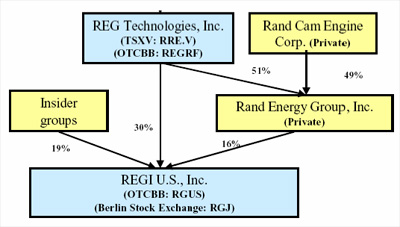
Some companies have complicated ownership structures. Perhaps there are complicated crossholdings. Explaining this is usually simplified by using a diagram (the example below is taken from the 2006 Bridge IR report available on the Reg/Regi US site)
What about the directors – how much stock do they hold? This information is usually available in the Corporate Governance section, or in the online report, but providing a link from the page that details the shareholder base would be illuminating, though very rarely done.
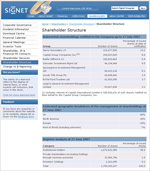
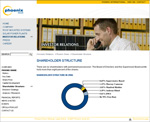
Signet do provide details of the percentage held by the directors as a group; of course, the bigger the company, the less significant each person’s holdings are. Smaller companies, such as Phoenix Solar, can clearly indicate the percentage held by each director.
As you can see, there are a variety of ways to explain to your visitors just who has a financial interest in your company. Which ways do you provide – and which have I missed?
Lucy is Editor at Corporate Eye
